A network monitoring dashboard is a central interface for tracking network performance, detecting issues, and maintaining system stability. It provides real-time data on network activity, allowing IT teams to identify irregularities, review usage patterns, and manage resources. By collecting key metrics in one place, these dashboards support troubleshooting, security monitoring, and overall network management. Selecting a dashboard involves considering factors like scalability, real-time monitoring features, and compatibility with existing systems.
What is a Network Monitoring Dashboard?
A network monitoring dashboard provides a consolidated interface for analyzing several network components, allowing for quick analysis of performance, inventory, and use statistics. By centralizing critical indicators, it simplifies network administration, allowing for early detection of possible faults and trend prediction.
The logistics and delivery industry has increasingly relied on network monitoring dashboards to optimize their operations, with many courier business owners discovering that real-time visibility into their fleet management systems, GPS tracking networks, and communication infrastructure can mean the difference between on-time deliveries and frustrated customers.
A well-designed network monitoring dashboard becomes particularly crucial for any courier business operating across multiple cities or regions, as it allows dispatchers to instantly identify network bottlenecks that could delay package tracking updates, disrupt driver communications, or cause system outages during peak delivery periods.
Benefits of a Network Management Dashboard
- Centralized Data Access – Combines network data into a single view;
- Time Efficiency – Fast access to data minimizes laborious searches;
- Quicker Troubleshooting – Identifies and fixes problems quicker;
- All-inclusive Reporting – Offers historical and current perspectives;
- Interface Customization – Adjusts to the demands and roles of users;
- Performance Monitoring – Tracks network health and efficiency;
- Security Measures – Identifies vulnerabilities and reduces risks.
Understanding the network monitoring benefits further highlights why these features are essential for maintaining a reliable and secure IT system. A well-organized dashboard improves troubleshooting, strengthens security measures, and offers real-time information, all of which expedite network monitoring and increase overall efficiency.
How to Choose the Right Network Monitoring Dashboard
For tracking performance, spotting issues, and preserving system stability, a network monitoring dashboard is essential. With so many options available, picking the ideal one requires carefully weighing a number of factors.
Identify Your Network Monitoring Needs
Before selecting a dashboard, consider your network’s exact requirements. Consider:
- Network Size: Small organizations may require simple monitoring, whilst huge corporations demand comprehensive analytics;
- Type of Monitoring: Do you need real-time traffic analysis, security threat identification, or bandwidth use tracking?;
- Integration Requirements: Ensure compatibility with current IT infrastructure, cloud services, and security technologies.
Evaluate Real-Time Monitoring Capabilities
A network monitoring dashboard must provide real-time information to maintain network stability and performance. Key performance parameters including CPU utilization, bandwidth consumption, and server uptime must all be tracked for effective monitoring. Immediate notifications for concerns like outages, bottlenecks, and security threats enable prompt action to avoid interruptions. Furthermore, configurable displays enable users to emphasize the most important facts, resulting in rapid and efficient decision-making.
Consider Ease of Use and Customization
Ease of use is another important consideration when choosing a network monitoring panel. A well-designed interface should provide clear visuals that make it simple to analyze network data without requiring extensive technical expertise. Drag-and-drop customization tools allow users to easily adjust reports and widgets, ensuring that the dashboard is tailored to their individual needs. Automated reporting features improve usability by delivering scheduled performance summaries, allowing IT teams to follow network trends over time with no manual effort.
Check Scalability and Performance
As network demands grow, the monitoring solution should scale accordingly. Ensure:
- Support for Expanding Networks: The ability to add more devices and endpoints;
- Cloud and Hybrid Compatibility: For businesses with mixed on-premise and cloud infrastructures;
- Minimal System Impact: Efficient data collection without causing network slowdowns.
Assess Security and Compliance Features
A network monitoring dashboard’s primary duty is to ensure security and regulatory compliance. Robust security measures assist in securing sensitive data by recognizing possible dangers, such as illegal access or suspicious behavior. Encryption and access control systems protect information, allowing only authorized users to see or alter network data. Furthermore, compliance assistance is critical for firms that must comply with industry rules such as GDPR or HIPAA, which assists them in meeting security and data privacy obligations.
Verify Integration and Automation Capabilities
A good dashboard should work with other IT tools and automate routine processes:
- Third-Party Integrations: Compatibility with firewalls, cloud platforms, and SIEM tools;
- API Support: Enables customization and advanced automation;
- AI-Powered Analytics: Some dashboards use machine learning for predictive monitoring.
Top Network Monitoring Tools
ManageEngine OpManager Network Monitoring Dashboard
Efficient network management is dependent on clear, actionable data supplied to the appropriate audiences. The OpManager Network Monitoring Dashboard is a centralized, customizable platform that allows IT managers to easily discover network faults and monitor performance. With over 90 customizable widgets, OpManager transforms raw data into meaningful insights, resulting in an effective and structured monitoring experience across IT systems.
Key features of the Network Monitoring Dashboard:
- Fully Customizable Dashboard – Personalize views to display critical metrics upon login;
- Comprehensive Network Visibility – Keep track of routers, switches, firewalls, servers, apps, URLs, printers, UPS, and more;
- Real-time Performance Metrics: Get quick insights on network health, alerts, and performance trends;
- One-Click Data Refresh – Ensure access to the latest network performance data;
- Advanced Troubleshooting – Quickly identify root causes of slow performance, high resource utilization, or connectivity issues;
- Remote Monitoring & Troubleshooting – Diagnose problem devices without direct intervention.
IT teams utilize the Network Monitoring Dashboard to monitor network performance, see real-time statistics, and change settings depending on business needs. One significant advantage is the ability to effectively monitor network health and performance. The dashboard enables managers to identify and respond to device alerts and key events while measuring CPU, memory, disk, and bandwidth utilization in real time. This proactive strategy reduces performance concerns and downtime.
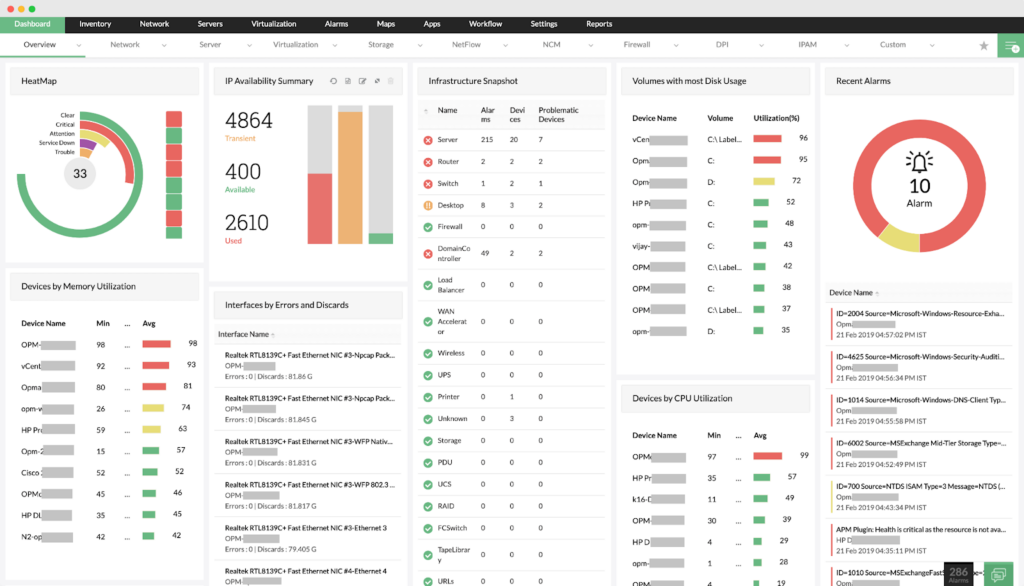
The dashboard also provides real-time information on IT resources such as device availability, response times, and WAN connections. Administrators may utilize performance graphs to evaluate network resources and connections, leading to faster troubleshooting and improvement.
IT teams may personalize the dashboard to meet their requirements. Devices can be organized by vendor, kind, location, or function, making it easier to manage network components. The dashboard also includes SLA widgets and custom text or HTML links for rapid access to important information.
The dashboard supports complex visualization and plasma views, allowing IT teams to project dashboards on several displays for continuous monitoring. Administrators may also switch between numerous dashboards at predetermined intervals, ensuring a complete picture of network performance across all parts of IT infrastructure.
SGRwin Tool
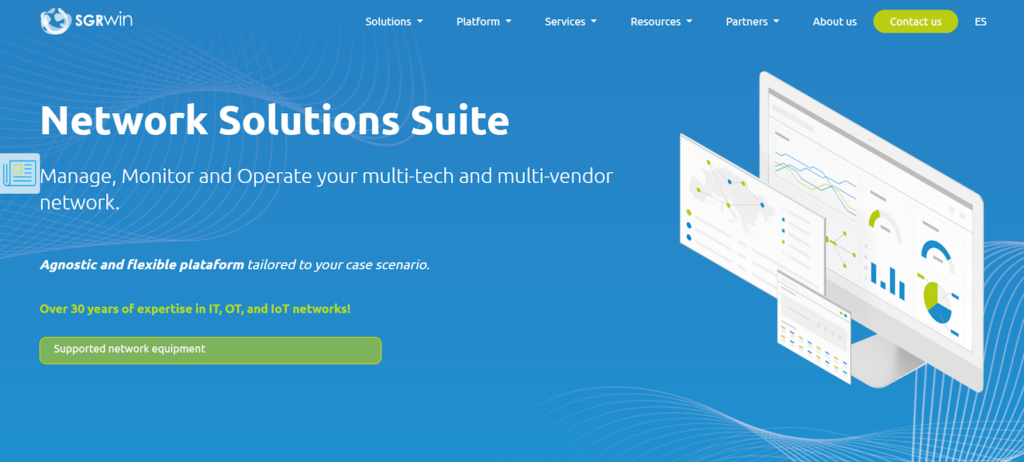
SGRwin is a complete network management system that streamlines monitoring and performance analysis. It offers both basic and customized dashboards, allowing customers to tailor the interface to their own requirements. The platform offers a variety of add-on components, enabling flexible and scalable network administration.
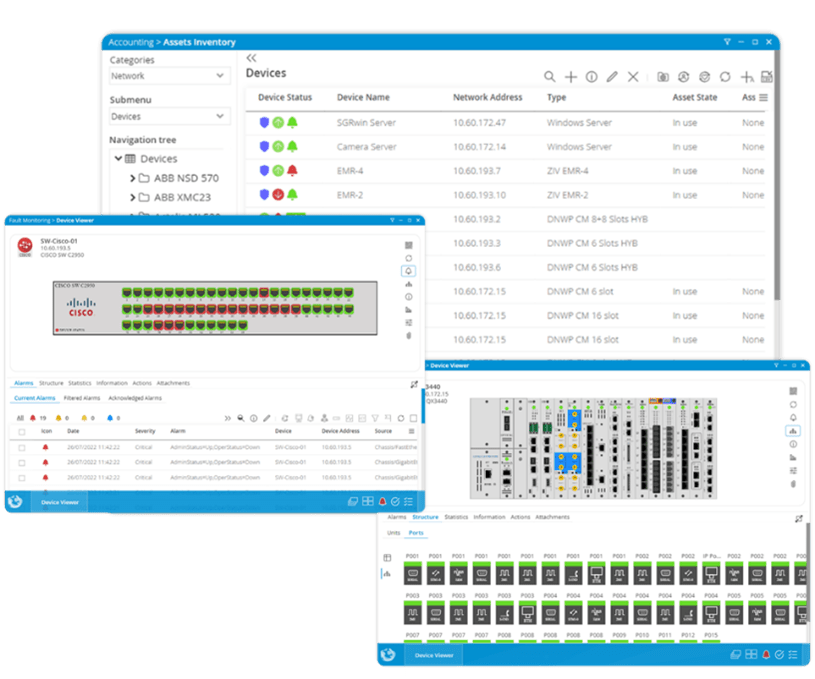
Key Features:
- Customizable Dashboards – Configure dashboards with essential or advanced data visualization;
- Intuitive Interface – Drag-and-drop functionality simplifies customization;
- Advanced Reporting – Generate and export hundreds of reports with real-time and historical data;
- Versatile Data Integration – Incorporate charts, tables, and counter reports for performance, alarms, inventory, and more;
- Business Intelligence Capabilities – Provides in-depth analytics for improved decision-making;
- Enhanced User Control – Manage access authorizations and set up user-specific views;
- Modern Design – Clean and responsive interface for a smooth user experience;
- Efficiency Tools – Includes shortcuts and filters for quick access to relevant information.
SGRwin provides a comprehensive network monitoring solution that combines ease of use with advanced analytics to improve network performance and security.
Paessler PRTG Network Monitor
Paessler PRTG Network Monitor is an adaptable and comprehensive network monitoring system that tracks performance, detects problems, and provides real-time insights. It combines SNMP, packet sniffer, and WMI to monitor different network segments, assisting IT teams in maintaining network stability and efficiency. The system automatically scans network segments to discover devices and allows users to customize monitoring with a wide range of sensors tailored to specific network components.
Key Features:
- SNMP Monitoring – Collects performance data from SNMP-enabled devices;
- Bandwidth Tracking – Monitors network bandwidth usage for better resource allocation;
- Device Discovery – Scans IP segments to detect and add network devices automatically;
- Threshold-Based Alerts – Notifies administrators when certain conditions or performance thresholds are met;
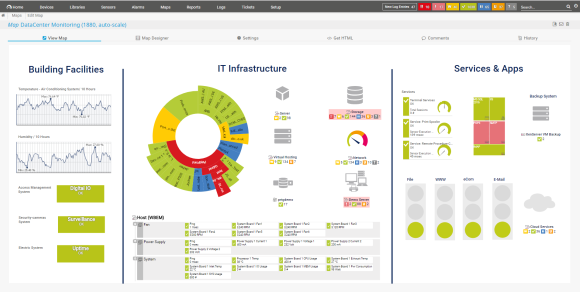
- Custom Network Maps – Provides visual representations of the network with a drag-and-drop editor and over 300 customizable objects;
- Flexible Notification System – Alerts can be sent via email, SMS, push notifications, Slack messages, Syslog, SNMP traps, HTTP actions, and more;
- Freeware Version – A free edition supports up to 100 sensors, making it accessible for small businesses.
PRTG is particularly strong in website response time monitoring, featuring a Web Page Sensor that records page load times. This can be used on-demand or scheduled for continuous tracking. The system also includes a Ping-based website availability monitor, ensuring visibility into uptime and performance.
Datadog Network Monitoring
Managing networks in multi-cloud, hybrid, and on-premises systems can be challenging, but Datadog Network Monitoring provides a unified solution. It helps teams to correlate network, application, and infrastructure data in order to quickly detect and fix issues using intelligent insights and warnings.
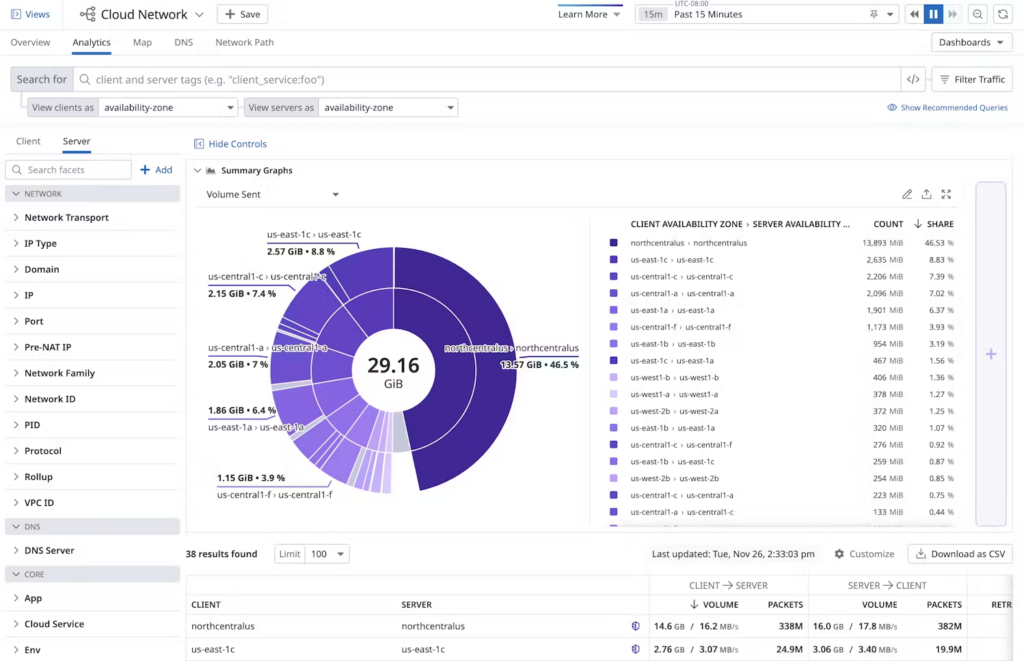
Datadog’s Cloud Network Monitoring (CNM) solution gives you real-time visibility into cloud-native microservices and connection performance across many endpoints. Network Device Monitoring (NDM) enables the unified tracking of both physical and virtual network devices, resulting in comprehensive WAN and hybrid network management.
Datadog Network Monitoring enables users to:
- Correlate application, infrastructure, and network monitoring data to understand performance across all layers;
- Gain visibility into traffic between cloud-native microservices, ensuring smooth communication;
- Monitor the connection between cloud and on-premises endpoints to detect performance issues early.
The Network Device Monitoring feature improves visibility by unifying data from physical and virtual devices. It supports various vendors, works with complex WAN and hybrid setups, and reduces resolution time by linking NetFlow traffic to device performance, helping IT teams quickly identify and fix issues.
Conclusion
A network monitoring dashboard helps track performance, detect issues, and maintain system stability. It centralizes data, offers real-time insights, and enables quick troubleshooting. Choosing the right dashboard requires evaluating scalability, integration, and security. The right solution improves network management, reduces downtime, and increases efficiency.
